
The Law Society of England & Wales recently published its Annual Statistics Report for 2021, its compendium and analysis of useful numbers about the trends in the solicitors profession. (In fact, it is the second report published this year, the 2020 report having been delayed by the Covid pandemic.)
I have followed these reports for many years, charting the ups and downs in the trends. I was therefore brought up short by this comment by the President of the Law Society, as reported in Legal Futures: “The decline in the number of firms also highlights the need for widespread investment in our justice system including legal aid rates to ensure lawyers are there when needed.”
The reason that I. Stephanie Boyce’s comment grabbed my attention is that the two elements of the sentence (decline and need for public investment) do not on the face of it appear to be supported by the data or even connected. Some further digging into the report and other sources was called for.
Fewer firms
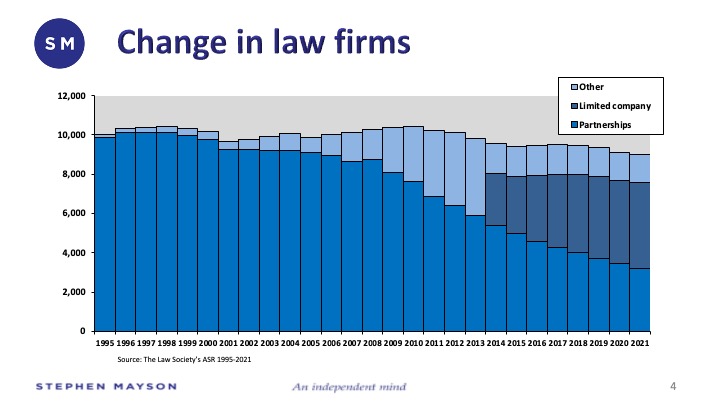
The President’s statement that the number of solicitors’ firms is reducing is, on the Law Society data, certainly true. Having hovered around the 10,000 mark for more than 20 years, it has declined over the past 10 by 10% to a little over 9,000 in 2021 (Table 3.3). What is more stark, perhaps, is that the dominant legal structure of those firms has also been transformed over that period. Whereas once the ‘traditional’ professional partnership was (apart from solo practice) the dominant structure, since incorporation was allowed – and the data tracked – that has become the most common legal form.
So, on the face of it, there has indeed been a decline in the number of law firms. But if one turns to the data published by the Solicitors Regulation Authority, and in particular their breakdown of solicitors firms to the same date as the Law Society (July 2021), there were 9,943 regulated solicitors’ firms – no real decline at all from the long-term figure of 10,000.
We have no idea which dataset is the most accurate or reliable. Could the difference be accounted for by the number of law firms that are alternative business structures (ABSs)? Possibly. The SRA data claims to include ABSs, although it does not identify them as a distinct group. However, at the same date, the SRA is said by the Legal Services Board to have licensed over 1,000 ABSs. Although the Law Society’s report defines ABSs in its glossary, it makes absolutely no reference to them in the body of the report. The difference of almost 1,000 firms as between the regulator and the representative body does beg some important questions.
More solicitors
Let us park for the moment the question of how many law firms there might truly be. Where there is absolutely no evidence of any decline in numbers is in the total number of solicitors holding practising certificates. This number rises year-on-year (with the exception of a minor blip about 10 years ago). The profession has near-doubled in number this century, and tripled since 1988 (cf. Table 2.1). This growth has been driven mainly by the admission of women: while the number of male solicitors has not yet doubled since 1988, the number of women has increased eight-fold. Women have outnumbered men in the solicitors’ profession since 2017.

The Law Society trends also show that, over time, more solicitors who hold practising certificates are working in settings other than private practice (cf. Table 3.1). Even so, the numbers in private practice have increased in the past 20 years by almost 30,000 (42%) to over 97,000 (Table 4.1).
So, fewer firms, but larger
Putting these two parts of the analysis together, to the extent that there are fewer firms (or even if the number of firms has remained broadly constant), they now have significantly more solicitors in them. In short, and on average, firms have grown. But this average hides an important market distortion.
The proportion of the total number of firms (even if 10,000 has reduced to 9,000) represented by sole principals and firms with fewer than five partners remains stubbornly where it has been for at least 30 years, at around 87%. The vast majority of law firms, therefore, are and remain ‘small’. They are also most likely to reflect geographical dispersion and so offer the local service that many might associate with their ‘local solicitor’. The solicitors’ profession on this evidence is still very much a highly fragmented part of the legal services sector.
But again, we need to go behind the data. Ten years ago, these small firms numbered around 8,800 and about 27,000 solicitors worked in them. In 2021, although the report records 1,000 fewer small firms, almost 30,000 solicitors worked in them (Tables 3.5 and 4.2). This structural point is consistent with the market in general: fewer firms, but larger in size.
What has declined markedly, though, is the number of sole practitioners (those who practise on their own – as opposed to sole principals, who are also sole owners but who employ other solicitors), where there are now reported to be 600 fewer than 10 years ago. Indeed, for the first time, the Annual Statistics Report shows that the number of sole principals is less than the number of 2-4 partner firms (Table 3.5).
Even so, overall, the distribution of law firms by size (Table 3.5) shows virtually no change (as I have tracked it over 30 years):

The large grow ever larger
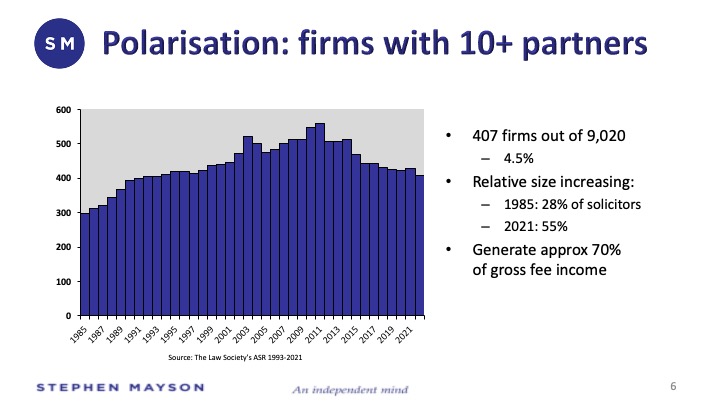
It is worth noting that, until 1967, professional partnerships were prohibited by law from having more than 20 partners. The growth in the largest law firms has therefore taken place in about 50 years. Even so, after that time there are still only about 400 firms with more than 10 partners, and fewer than 200 with more than 25 partners (Table 3.5). As the following chart shows, there has even been consolidation among these large firms, with the total dropping from a peak of around 550 firms in 2011.
There is a clear process of ‘polarisation’ taking place, in which the distance between the smallest law firm (the sole principal) and the largest grows ever greater (with some firms now with several hundred partners – although not all of them will be partners in the UK).
But although small in number, these ‘large’ firms dominate the economics of legal practice – demonstrating even greater financial and employment polarisation. Whereas 35 years ago, this group of the largest firms (more than 10 partners) would have accounted for just over a quarter of all solicitors in private practice, in 2021 the group – comprising less than 5% of all firms – accounted for 55% of solicitors in private practice (Tables 3.5 and 4.2). There were an average of 130 solicitors in each firm.
In a further demonstration of polarisation, though, the average size of firms in 2021 with more than 25 partners was 236 solicitors, while those with more than 80 partners averaged 450 solicitors. (These figures relate only to solicitors and do not include other qualified legal staff or other staff who are not legally qualified at all but perform some chargeable client work.)
The UK legal economy also continues to grow year-on-year. It is reported to have reached £41.5 billion for 2021. But just as there is polarisation in the numbers of lawyers employed, so there is polarisation in productivity. The ‘large’ firms of more than 10 partners are thought to be responsible for about 70% of total turnover, and the largest 100 firms (adjusted to exclude international income) for about 50% of it.1 In other words, about 1% of all UK law firms generate half of all legal services income, leaving the other half being produced by 99% of firms.
It is perhaps not surprising, then, that the legal and national media concentrate on reporting this exceptional (but arguably distorting) view of the economic performance, and associated profitability, of the country’s law firms. In fact, there are at least two distortions operating here. The first is that, as these data show, the polarisation that results in the high numbers reflects only a tiny proportion of law firms, rather than the ‘fat cat’ riches wrongly ascribed by association to the other 99% of firms and 45% of lawyers in private practice.
The second distortion is that the legal media has fixated for many years now on ‘profit per equity partner’ (PEP) as a measure of a large law firm’s success. Not surprisingly, the largest firms have responded to this by ‘managing’ their disclosed results to be able to report as a high a PEP as possible. Two major consequences flow: firms can be tempted delay or reduce investments in capability, technology, and organisational resilience by limiting expenditure; and they reduce, over time, the number of lawyers who become equity partners.
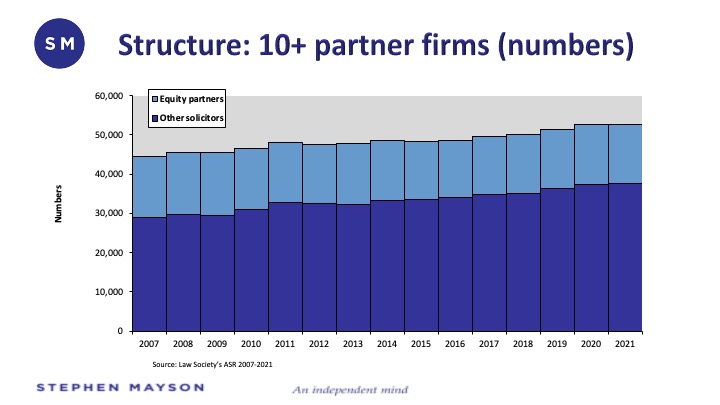
This is also reflected in the changes in ‘leverage’, that is, the ratio of other lawyers to equity partners. As Legal Futures reports, somewhat starkly: “Last year, 28% of solicitors in private practice were partners but in 2007, for example, it was 38%, compared to 46% in 1997 and 66% in 1987.” There are as a result relatively fewer opportunities for solicitors to progress to partnership.

This has led to a further example of polarisation within the profession: the difference between the earnings of full equity partners and of others in the firm has continued to grow, leading to challenges of morale and motivation. Nevertheless, at the extreme, the scale of the difference can largely only be imagined when there are reports of some newly minted lawyers being paid £185,000 a year!
Diversity and inclusion challenges
There is also a wealth of data in the Annual Statistics Report relating to diversity. While the solicitors’ profession is undoubtedly becoming more diverse, its track record on inclusion appears less positive. Even though women now make up 51% of solicitors in private practice (Table 3.1), only 18% of partners are women compared to more than twice that percentage (39%) for men (Table 4.3). The rate of progress to partnership remains slower than the growth in the proportion of women in the profession.
With the ethnicity of 22,000 solicitors (22.5%) being unknown, the Annual Statistics Report data on ethnicity in the profession are less complete than would be desirable. However, the available data show that minority ethnic groups represent in total about 12.5% of all solicitors in private practice (or 16% of those whose ethnicity is known) (Table 4.5). These percentages are broadly in line with the 15% estimates for the population of England & Wales, though the report demonstrates that the area with the greatest under-representation of solicitors from minority ethnic backgrounds as compared to the working population generally is in Greater London (Chart 11). The data also show (Table 4.5) that 25% of those in ethnic minority groups are partners (compared to more than a third of White solicitors) – though there is a better chance of ownership opportunities in firms with fewer than 5 partners (Table 4.6).
As the President rightly remarked, there is certainly “more work to be done in increasing representation”.
Decline and investment
On the face of it, then, I find the evidence of ‘decline’ thin. There may have been a reduction in the total number of solicitors’ firms (for the reasons explored earlier, though, that is not completely clear). The number of large firms has certainly fallen in the last 10 years, but this has been counterbalanced by internal growth as those fewer firms in number have continued to recruit and grow, and they employ relatively more solicitors than before. Given their tendency to be established in major cities, geographical concentration will mean that a reduction in their number is not likely to have had any significant effect on the availability of their services to clients.
There is also some evidence that much the same process of consolidation has been taking place among smaller firms, as sole principals and 2-4 partner firms have concentrated more people into fewer entities. Here, though, there might have been some limiting effects on geographical dispersion.
But it could be misleading to characterise these falls in number as a ‘decline’ in the profession overall. With more lawyers than ever, and law firms that are, generally, growing in size and productivity, the narrative of decline is a tricky one to advance. But it is not without merit. The problem is that the Annual Statistics Report does not offer the most telling evidence.
A comparison of the geographical distribution of solicitors’ firms over time is difficult. Because of the discrepancy in the data about the total number of law firms as described earlier, the apparent decline in the number of private practice firms regionally (other than in the City and central London) is impossible to measure with any degree of confidence. Further, while the distribution of solicitors with practising certificates shows some changes in regional distribution (Table 2.2), the numbers for solicitors in private practice firms by region are no longer given.
Consequently, we cannot be clear about whether there really is a decline in the number of firms in some regions, or a decline in the number of private practice solicitors in those regions (or both). As with the overall picture, it is possible that there are fewer firms but with more solicitors in them. This might present a challenge for clients who have to travel further to geographically dispersed firms, but in the absence of evidence it is difficult to see that there is in fact a decline in the number of solicitors available to represent citizens in different parts of the country.
For several years now (and for justifiable reasons), the annual statistics reports have not reported trends by practice area. This, though, could have given some indication of relative decline in the volume or value of certain types of work, or in the numbers of solicitors working in those areas.
Perhaps the clearest and most disturbing evidence of such decline can be found in the recent Independent Review of Criminal Legal Aid, conducted by (the then) Sir Christopher Bellamy QC.2 The final report lays bare the shocking extent of this decline in the number of firms, the number of practitioners, and the economics of criminal legal aid practice. This is certainly an area where the President’s call for attention to a decline and for widespread investment is entirely justified.
While there are certainly some instances of fewer law firms and fewer lawyers being available to meet the legal needs of citizens, the Annual Statistics Report 2021 does not paint an unquestionable picture of general decline; nor does it present a profession in need of widespread public investment. Taken in the round, it looks like a success story. The assertion of decline and of a need for investment is much more nuanced. So, while I can agree with the President’s sentiments in (small and targeted) part, if applied more generally I remain unpersuaded.
Unfortunately, the implicit exaggeration reminds me of previous Law Society research that was picked up by the House of Commons Justice Select Committee in the early days of the coronavirus pandemic. The Committee then reported a headline-grabbing anticipated decline in the number of law firms – potentially by more than half. However, it was followed within months by reports of recovery in workloads and of growth, recruitment difficulties and salary increases. Between 2020 and 2021, legal sector turnover increased by £5 billion (14%). The hyped-up decline did not happen. I’m not suggesting that there was no pain for any law firm during that period – far from it – but it shows that putting too much negative spin on data that do not fully bear the weight of the proposition can become very unconvincing.
All that said, in a sector that often lacks data on its structure and performance, the Law Society should be commended for maintaining its publication of the annual statistics reports. They record an intriguing and continuing story of fragmentation and polarisation – and arguably one not of decline and a need for greater public investment but of growth and a need for greater inclusion.
___________________________________________
1. These percentages are necessarily rough-and-ready, being derived from commercial publications that report (often publicly unverifiable) law firm turnover figures on an annual basis, relative to total turnover recorded by the Office for National Statistics.
2. In the interests of full disclosure: I served as a member of the Review’s expert panel.

I wonder whether the difference in figures might in part (but not all) be down to firms with multiple entities – for example international firms, which typically have several authorised bodies under one umbrella, and larger private client firms with trust corporations, some of which historically were separately authorised.